ACTIVITIES
Activity #Opening
Instructions: Watch the two videos below and following the instructions on what notes to take in your science journal.
Instructions: Watch the two videos below and following the instructions on what notes to take in your science journal.
While taking notes look for:
- Shape of the wave - draw one in your science journal
- How Hamilton gets out to the wave
- How the jet boat piloted by Darrick Doerner tows Hamilton parallel to the face of the wave but remains steady as Hamilton enters the wave
- How Hamilton drops his left hand down to the water for stability
- How do you know Teahupoo has a lot of energy?
- Are waves moving water???? or moving energy????
Activity #1. Initial Individual Answer - answer the phenomenon question "Are all waves the same?" in your science journal. Think about the different types of waves that you know about before contemplating the answer to this question.
Activity #2. Team Initial Answer Poster and Presentation - share your individual answers with your team. As a team come up with a poster and a presentation that explains your initial thinking in regards to the phenomenon question.
Activity #2. Team Initial Answer Poster and Presentation - share your individual answers with your team. As a team come up with a poster and a presentation that explains your initial thinking in regards to the phenomenon question.
Activity #3. Watch the video below and the simulations of the different types of waves.
1. Take notes and define the four different types of waves.
2. Draw a picture of each wave type to help you remember how these waves work
3. What did you learn about waves? Write a paragraph explaining what you have learned about waves.
1. Take notes and define the four different types of waves.
2. Draw a picture of each wave type to help you remember how these waves work
3. What did you learn about waves? Write a paragraph explaining what you have learned about waves.
Activity #4. Kobe Earthquake 1995
A. Watch the following video: "Terremoto en Kobe" and take good notes.
B. Read the following information about the Earthquake in Kobe, Japan:
The earthquake in Kobe on January, 17, 1995 left 6,425 dead, injured 25,000, displaced 300,000 people, damaged or destroyed 100,000 buildings and caused at least $132 billion worth of damage, or about 2.5 percent of Japan's national income, making it one of the most expensive natural disasters in history. Only about $3 billion was covered by insurance.More than 35,000 people were pulled from collapsed buildings by neighbors or rescue workers. Japanese refer to the disaster as the Great Hansin Earthquake. [Source: T.R. Reid, National Geographic, July 1995]
Beginning at 5:46am, the temblor lasted for 20 seconds, registered 6.9 on the Richter scale and packed a wallop of 240 kilotons of TNT. Over 50,000 buildings were destroyed or badly damaged and 300,000 people were left homeless. A major freeway collapsed, streets were uplifted, and railroad tracks buckled and twisted. Fire raged on and off for two days, and gas and water mains were ruptured.
The earthquake was the worst in Japan since the Great Tokyo Earthquake in 1923, when an earthquake measure 7.9 on the Richter Scale killed 140,000 people, and the greatest disaster in Japan since World War II. It was caused by a strike-slip jolt (sudden lateral movement of one rock mass against another) on the Nojima Fault, which up until then was not considered a dangerous fault.
The epicenter of the earthquake was 40 miles away from Kobe in the Akashi Strait between Awaji Island and Honshu. During the quake the sides of the fault shifted 6 to 10 feet in opposite directions. The surface along the fault moved five feet in one place. This movement could be seen in a rice field on Awaji Island.
There were several reasons why the earthquake was so devastating. First of all the earthquake was very shallow, which means it is more likely to cause extensive damage. Second, Kobe lies in area that many Japanese thought was unlikely to be hit by a major earthquake and thus the residents there were not prepared for a major quake. Kobe is considered one of the nicest cities in Japan and ironically some people even moved there to escape earthquakes.) SOURCE: Park City School District - Science Lead
C. Read the following information from the UPSeis group about Seismology:
What Is Seismology?
Seismology is the study of earthquakes and seismic waves that move through and around the earth. A seismologist is a scientist who studies earthquakes and seismic waves.
What Are Seismic Waves?
Seismic waves are the waves of energy caused by the sudden breaking of rock within the earth or an explosion. They are the energy that travels through the earth and is recorded on seismographs.
Types of Seismic Waves
There are several different kinds of seismic waves, and they all move in different ways. The two main types of waves are body waves and surface waves. Body waves can travel through the earth's inner layers, but surface waves can only move along the surface of the planet like ripples on water. Earthquakes radiate seismic energy as both body and surface waves.
BODY WAVES
Traveling through the interior of the earth, body waves arrive before the surface waves emitted by an earthquake. These waves are of a higher frequency than surface waves.
P WAVES
The first kind of body wave is the P wave or primary wave. This is the fastest kind of seismic wave, and, consequently, the first to 'arrive' at a seismic station. The P wave can move through solid rock and fluids, like water or the liquid layers of the earth. It pushes and pulls the rock it moves through just like sound waves push and pull the air. Have you ever heard a big clap of thunder and heard the windows rattle at the same time? The windows rattle because the sound waves were pushing and pulling on the window glass much like P waves push and pull on rock. Sometimes animals can hear the P waves of an earthquake. Dogs, for instance, commonly begin barking hysterically just before an earthquake 'hits' (or more specifically, before the surface waves arrive). Usually people can only feel the bump and rattle of these waves.
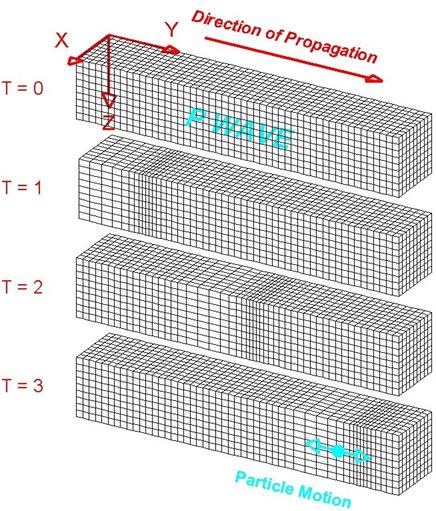
P waves are also known as compressional waves, because of the pushing and pulling they do. Subjected to a P wave, particles move in the same direction that the the wave is moving in, which is the direction that the energy is traveling in, and is sometimes called the 'direction of wave propagation'. Click here to see a P wave in action.
FIGURE 1 - A P WAVE TRAVELS THROUGH A MEDIUM BY MEANS OF COMPRESSION AND DILATION. PARTICLES ARE REPRESENTED BY CUBES IN THIS MODEL. IMAGE ©2000-2006 LAWRENCE BRAILE, USED WITH PERMISSION.
S WAVES
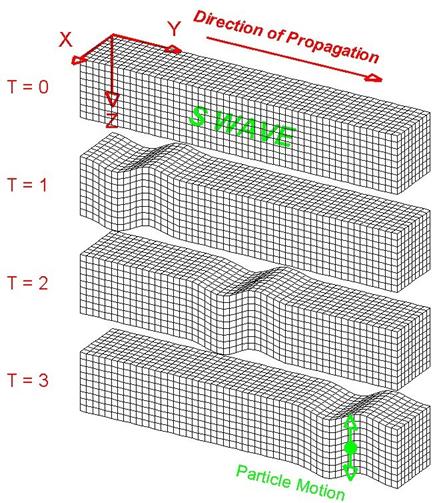
The second type of body wave is the S wave or secondary wave, which is the second wave you feel in an earthquake. An S wave is slower than a P wave and can only move through solid rock, not through any liquid medium. It is this property of S waves that led seismologists to conclude that the Earth's outer core is a liquid. S waves move rock particles up and down, or side-to-side--perpendicular to the direction that the wave is traveling in (the direction of wave propagation). Click here to see a S wave in action.
A. Watch the following video: "Terremoto en Kobe" and take good notes.
B. Read the following information about the Earthquake in Kobe, Japan:
The earthquake in Kobe on January, 17, 1995 left 6,425 dead, injured 25,000, displaced 300,000 people, damaged or destroyed 100,000 buildings and caused at least $132 billion worth of damage, or about 2.5 percent of Japan's national income, making it one of the most expensive natural disasters in history. Only about $3 billion was covered by insurance.More than 35,000 people were pulled from collapsed buildings by neighbors or rescue workers. Japanese refer to the disaster as the Great Hansin Earthquake. [Source: T.R. Reid, National Geographic, July 1995]
Beginning at 5:46am, the temblor lasted for 20 seconds, registered 6.9 on the Richter scale and packed a wallop of 240 kilotons of TNT. Over 50,000 buildings were destroyed or badly damaged and 300,000 people were left homeless. A major freeway collapsed, streets were uplifted, and railroad tracks buckled and twisted. Fire raged on and off for two days, and gas and water mains were ruptured.
The earthquake was the worst in Japan since the Great Tokyo Earthquake in 1923, when an earthquake measure 7.9 on the Richter Scale killed 140,000 people, and the greatest disaster in Japan since World War II. It was caused by a strike-slip jolt (sudden lateral movement of one rock mass against another) on the Nojima Fault, which up until then was not considered a dangerous fault.
The epicenter of the earthquake was 40 miles away from Kobe in the Akashi Strait between Awaji Island and Honshu. During the quake the sides of the fault shifted 6 to 10 feet in opposite directions. The surface along the fault moved five feet in one place. This movement could be seen in a rice field on Awaji Island.
There were several reasons why the earthquake was so devastating. First of all the earthquake was very shallow, which means it is more likely to cause extensive damage. Second, Kobe lies in area that many Japanese thought was unlikely to be hit by a major earthquake and thus the residents there were not prepared for a major quake. Kobe is considered one of the nicest cities in Japan and ironically some people even moved there to escape earthquakes.) SOURCE: Park City School District - Science Lead
C. Read the following information from the UPSeis group about Seismology:
What Is Seismology?
Seismology is the study of earthquakes and seismic waves that move through and around the earth. A seismologist is a scientist who studies earthquakes and seismic waves.
What Are Seismic Waves?
Seismic waves are the waves of energy caused by the sudden breaking of rock within the earth or an explosion. They are the energy that travels through the earth and is recorded on seismographs.
Types of Seismic Waves
There are several different kinds of seismic waves, and they all move in different ways. The two main types of waves are body waves and surface waves. Body waves can travel through the earth's inner layers, but surface waves can only move along the surface of the planet like ripples on water. Earthquakes radiate seismic energy as both body and surface waves.
BODY WAVES
Traveling through the interior of the earth, body waves arrive before the surface waves emitted by an earthquake. These waves are of a higher frequency than surface waves.
P WAVES
The first kind of body wave is the P wave or primary wave. This is the fastest kind of seismic wave, and, consequently, the first to 'arrive' at a seismic station. The P wave can move through solid rock and fluids, like water or the liquid layers of the earth. It pushes and pulls the rock it moves through just like sound waves push and pull the air. Have you ever heard a big clap of thunder and heard the windows rattle at the same time? The windows rattle because the sound waves were pushing and pulling on the window glass much like P waves push and pull on rock. Sometimes animals can hear the P waves of an earthquake. Dogs, for instance, commonly begin barking hysterically just before an earthquake 'hits' (or more specifically, before the surface waves arrive). Usually people can only feel the bump and rattle of these waves.
P waves are also known as compressional waves, because of the pushing and pulling they do. Subjected to a P wave, particles move in the same direction that the the wave is moving in, which is the direction that the energy is traveling in, and is sometimes called the 'direction of wave propagation'. Click here to see a P wave in action.
FIGURE 1 - A P WAVE TRAVELS THROUGH A MEDIUM BY MEANS OF COMPRESSION AND DILATION. PARTICLES ARE REPRESENTED BY CUBES IN THIS MODEL. IMAGE ©2000-2006 LAWRENCE BRAILE, USED WITH PERMISSION.
S WAVES
The second type of body wave is the S wave or secondary wave, which is the second wave you feel in an earthquake. An S wave is slower than a P wave and can only move through solid rock, not through any liquid medium. It is this property of S waves that led seismologists to conclude that the Earth's outer core is a liquid. S waves move rock particles up and down, or side-to-side--perpendicular to the direction that the wave is traveling in (the direction of wave propagation). Click here to see a S wave in action.
|
FIGURE 2 - AN S WAVE TRAVELS THROUGH A MEDIUM. PARTICLES ARE REPRESENTED BY CUBES IN THIS MODEL. IMAGE ©2000-2006 LAWRENCE BRAILE, USED WITH PERMISSION.
|
Lab #1: Making P-Waves and S-Waves Lab
SAFETY - To insure the safety of everyone in the demonstration, follow instructions and do NOT push one another.
Demonstration:
P-Wave through solid
P-Wave through liquid
S-Wave through solid
S-Wave through gas
Once students have demonstrated how these waves work, write down what you saw and what you learned from the demonstration. Also, answer the following questions:
Demonstration:
P-Wave through solid
P-Wave through liquid
S-Wave through solid
S-Wave through gas
Once students have demonstrated how these waves work, write down what you saw and what you learned from the demonstration. Also, answer the following questions:
- Which of the two types of waves involved a compression?
- Which of the two types of waves can go through all types of matter? explain why.
- Which of the two types of waves must go through a solid? explain why.
- In your own words, explain how a P-Wave moves and how a S-Wave moves. In an earthquake, which of these waves do you think creates the most damage and why?
|
|
|
|
|
Activity #5. Understanding Amplitude and Wave Energy
AMPLITUDE and WAVE ENERGY
A. Discuss with your team the differences between P-Waves and S-Waves - Write down how the waves are similar and how they are different in your science journal.
B. Think back to the video - Which waves did the store keeper and the customer see first? Write your answer and evidence in your science journal.
C. Explain which type of wave caused the shaking of the store in the video - what evidence do you have to back-up your answer? Write your answer and evidence in your science journal.
D. Based on what you've learned, explain what type of wave caused the high energy earthquake in Kobe, Japan.
AMPLITUDE and WAVE ENERGY
- Begin by stretching the Slinky 2 meters between your partner and yourself. One person will hold each end. Count floor tiles to measure distance.
- Have the third person place an object (white tub) about midway down the length and 1 floor tile from the slinky.
- Send a small transverse (S) pulse down the slinky and measure how far the box is displaced. Repeat with increasing larger pulses
- Create a table that documents three attempts to displace the tub. REMEMBER to be kind to the slinky!
A. Discuss with your team the differences between P-Waves and S-Waves - Write down how the waves are similar and how they are different in your science journal.
B. Think back to the video - Which waves did the store keeper and the customer see first? Write your answer and evidence in your science journal.
C. Explain which type of wave caused the shaking of the store in the video - what evidence do you have to back-up your answer? Write your answer and evidence in your science journal.
D. Based on what you've learned, explain what type of wave caused the high energy earthquake in Kobe, Japan.
LAB #2: Finding the Epicenter and Magnitude of an Earthquake Using Waves

1. As a class we will watch a short video to help us learn how Epicenters are found by using P-Waves and S-Waves
2. Go to the following URL: https://www.newpathonline.com/free-curriculum-resources/virtual_lab/Earthquake_Simulator/4/8/1835 and click on the view button toward the bottom of the page.
3. Read about Earthquakes and P-Waves and S-Waves and take notes in your science journal. When you reach the bottom of the page select "Japan region" for the earthquake in which we will figure out the epicenter and the magnitude for, then click on the "Submit Choice" button.
4. Read the information about "Determining the Earthquake Epicenter," take notes, and then click on "View Seismograph."
5. Figure out the S-P Interval for the Pusan, Tokyo, and Akita Seismic Stations. Be sure to follow the instructions you have been previously given and read. Once you've determined the number of seconds between the P and S Waves, click on the "Convert S-P Interval" button.
6. Read through the instructions that will help you determine the distance from the S-P Interval. Once you've determined the distance, click on the "Find Epicenter" button. Then read through the Triangulation information on the next page. Did you find the epicenter???
7. Click on the "Compute Richter Magnitude" button
8. Take notes while reading about the Magnitude of an earthquake and how the magnitude is calculated. Once you've read and taken notes on this page, click on the "Go to Next Page" button.
9. Read and take notes on the Richter Nomogram graph, then , click on the "Go to Next Page" button.
10. Using the graphs find the greatest amplitude of the S-Wave for each location and input your answers. Now click on the "Submit Nomogram" button.
11. Looking at the data information you provided, look at the Richter Nomogram graph and determine the Magnitude of the Earthquake, then click on "Confirm the Magnitude" button.
12. Did your estimated magnitude come close to the actual magnitude??? Complete the information for the certificate. Make a copy of the completed certificate and save it to your photos file. Recreate the table shown on this page with your data and the actual data in your science journal and email your certificate to your class' email account [email protected]
Pat yourself on the back for a job well done!
Lab: Light Experiments
Open the document below in Notability. Keep it handy throughout the labs to write in your data and to answer questions.
DECIDE who on your team will be the Reader, Resources Manager, and Team Manager.
READER will read all of the instructions and questions. They will also ask team members if they have any clarifying questions for Mrs. Smith. If so, the READER will bring the questions for Mrs. Smith to be answered.
RESOURCE MANAGER will be responsible for keeping track of all supplies and returning them at the end of class. They are also responsible for making sure that the team cleans up after each lab.
TEAM MANAGER will be responsible for making sure that everyone participates and completes their lab sheet.
| lightexperiments.pdf |
Activity #6. Reading About Sound and Light Waves
1. Using our Physical Science book, read through Chapter 10, starting on page 239-251; 254-top of 257; 258-261; 264-266. You will come across a graphic on page 239 that organizes sound and light waves, copy this graphic into your science journal.
ONLINE READING: Click here Read to the bottom of the page. Taking careful notes, writing down keywords and definitions and answering the questions at the beginning and end of the reading. Also read This Section, again taking careful notes, writing down keywords and definitions and answering the questions at the beginning and end of the reading.
2. When you come across any Self-Check questions, write the page number and the complete answer (write in complete sentences) in your science journal.
3. Be sure to collect important vocabulary words and their definitions along the way.
4. Complete the "Review" below:
"Big Waves"
For today, we will be going back and talking more about ocean waves. We will watch a video and apply what we have learned so far about waves.
Lab #3: Amplitude and Frequency of Waves - PHET Simulation
|
1. Open the PHET app on your iPad or if you're on a PC go to Phet.colorado.edu. Find the "Wave on a String" simulation.
2. Once you've opened the "Wave On a String" simulations, please check the following boxes: Rulers and Timer (in the lower right hand corner) Oscillation (in the upper left hand corner) 3. Then set the Amplitude for 0.25 cm and the Frequency for 0.25 Hz 4. To take measurement (other than to time a wave) you can click on the blue pause button. The simulation should be set up like FIGURE A 5. Your settings should look like this for the first set of trials. Use the Word Document below - I made the table for you ;) to record your trials and findings. Follow the settings in the table to record the wavelengths of the string. 7. For the second set of trials, click on the follow boxes:
Manual (in the upper left hand corner) Rulers and Timers (in the lower right hand corner) 8. Move the vertical ruler so that the 0 cm line is set up with the green bead in the wrench. It should look like the FIGURE B 9. You will be moving the wrench up to the 1 cm mark and then back down to the 0 cm mark to create a wave. 10. Fill in the data table as needed. 11. For Trials 16 - 20 use the timer to time how long it takes for the wave to return to the wrench. You will need a teammate to start the timer for you. 12. Complete the Word document and email it to your class' email address: [email protected] |
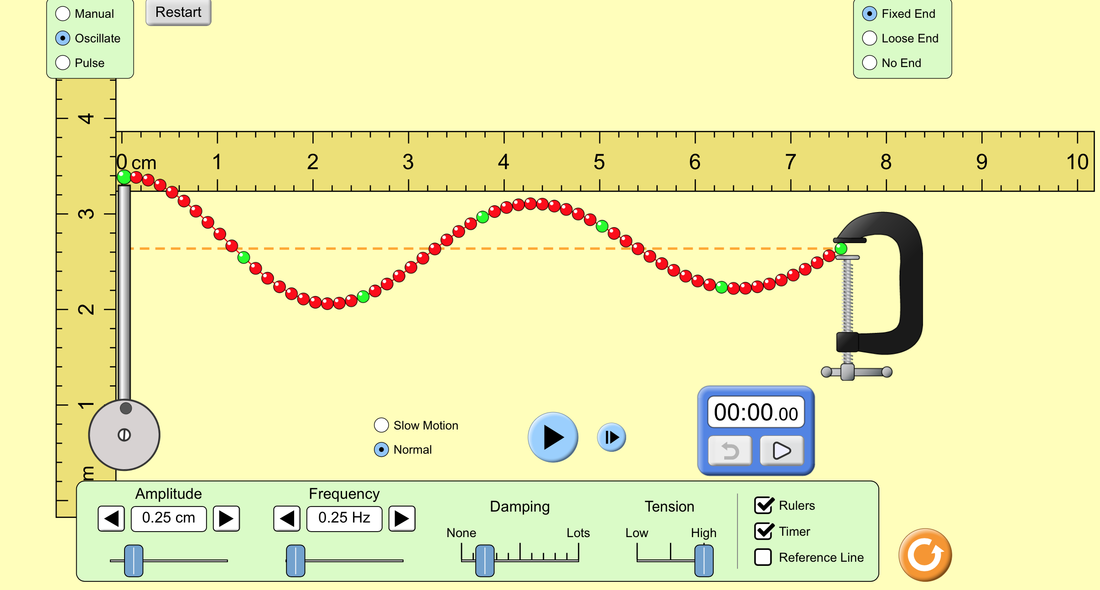
Figure A.
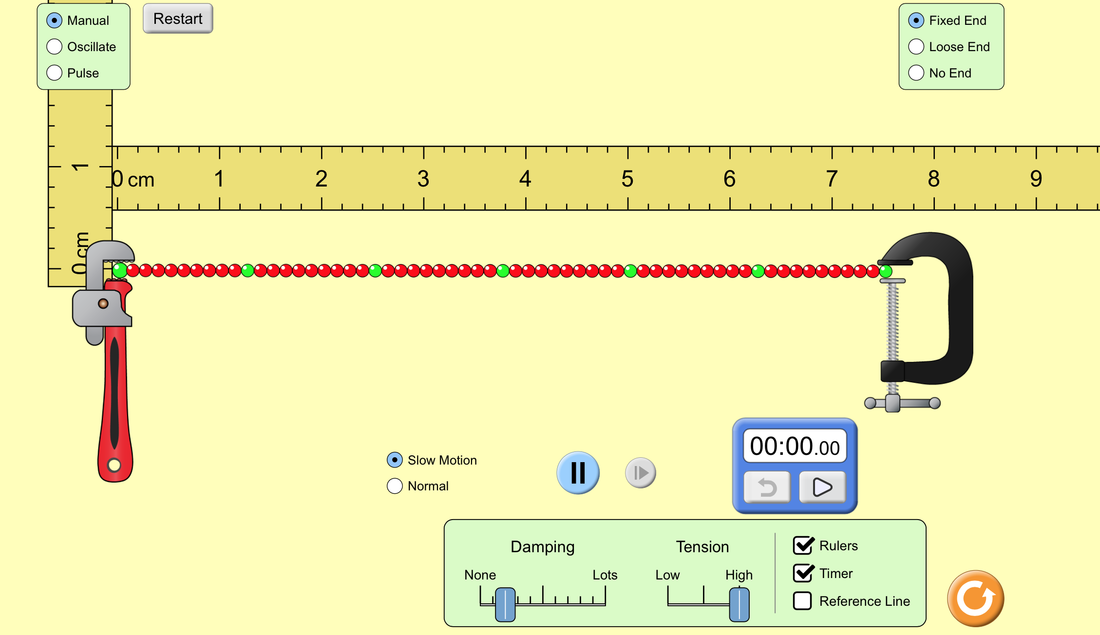
Figure B.
|
| stringsimulationphetdoc.docx |
Light Videos
Watch the following videos and take Cornell Notes for each...
"Light and Color" https://utah.pbslearningmedia.org/resource/lsps07.sci.phys.energy.lightcolor/light-and-color/
"Observing Refraction of Light" https://utah.pbslearningmedia.org/resource/lsps07.sci.phys.energy.lightrefract/observing-refraction-of-light/
"How Light Travels" https://utah.pbslearningmedia.org/resource/lsps07.sci.phys.energy.lighttravel/how-light-travels/
"Edison: Electric Light" https://utah.pbslearningmedia.org/resource/amex27-soc-edelectriclight/wgbh-american-experience-edison-electric-light/
Sound Presentation
1. Individually, read the PDF below on Sound Waves. Write down the key words and definitions that will help you talk about sound waves in your science journal. (7 minutes)
2. Together as a class we will watch a video about the progress of technology and sound. Then we will do an activity on Morse Code.
Video: Edison: From the Telephone and Telegraph Comes the Phonograph
3. After the Morse Code Activity we will do an interactive presentation together on sound. BEFORE WE START, write the following terms and their definitions in your science journal:
Key Lesson Terminology
Compression – The region of the wave where air particles are compressed together.
Rarefaction – The region of the wave where air particles are spread apart.
Frequency – Wiggles per second (moves back and forth)
Amplitude – For transverse waves, it is the maximum height of the wave. Larger amplitudes create louder sounds.
Look back at the notes you've previously taken from other Wave Readings and Notes, are these definitions different? If so, explain how. If not, explain why.
| sound_waves.pdf |
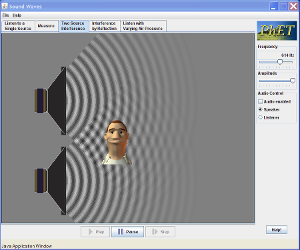
PHET LAB: Sound
We will be filling out the following worksheet, while we complete "Sound" Simulation
| Click to Run |
| phetsound__-_sound_and_wave_basics.pdf |
Activity #7: Sound Movies Mini Film Festival
Take notes, using Cornell Notes Form, for the following movies:
The Physics of Music
How Dolphins Echolocate and Imitate OR Sound Waves Underwater - The Loch Ness Monster
Can You Call a Cell Phone in a Microwave?
Why Do Things Sound Scary?
What does Sound Look Like?
Once you've watched the videos and taken the notes, put the notes pages in your science folder.
The Physics of Music
How Dolphins Echolocate and Imitate OR Sound Waves Underwater - The Loch Ness Monster
Can You Call a Cell Phone in a Microwave?
Why Do Things Sound Scary?
What does Sound Look Like?
Once you've watched the videos and taken the notes, put the notes pages in your science folder.
Lab #4: Light Labs
It's time for you to take a turn at being the teacher...
With your team, read through the posted URLs below and decide on one activity you would like to teach. You can take one of the following approaches:
https://www.exploratorium.edu/snacks/rotating-light
http://www.exploratorium.edu/science_explorer/reflecting_rainbows.html
https://www.exploratorium.edu/video/double-rainbows
https://www.exploratorium.edu/exhibit/aurora
https://www.exploratorium.edu/snacks/disappearing-glass-rods
https://www.exploratorium.edu/snacks/diffraction
https://www.exploratorium.edu/explore/videos/snacks/cd-spectroscope-introduction
https://www.exploratorium.edu/snacks/poking-fun-at-light-rays
https://www.exploratorium.edu/video/making-color
https://makingscience.withgoogle.com/science-journal/activities/activity-getting-started-light?lang=en
https://makingscience.withgoogle.com/science-journal/activities/activity-light-instruments-discovering-shadows?lang=en#setup
https://www.exploratorium.edu/video/light-island
https://docs.google.com/document/d/11vKrlnwcilA0bT3zdz2ZvRweuD_r185wZOQOoOj2JRQ/edit
So pick one, reserve it for your team, and get to work on being a teacher of light!
With your team, read through the posted URLs below and decide on one activity you would like to teach. You can take one of the following approaches:
- Pick a lab to demonstrate to the class and have the class answer questions (at least 5) that students will answer. With this teaching option you will need to come up with the learning objective (what students should learn about light from the demonstration), questions for the class to answer, and decide what roles the member of your team will do during the demonstration.
- Pick a lab activity for the class to do. You will create a lab sheet for teams to follow. The lab sheet should include: Learning objective (what students should learn about light from doing the lab activity), list of materials, list of roles, safety notes, detailed procedures, a list of data/observations that should be made, with a list of questions that should be answered at the end of the lab, and the needed clean up procedures that will be necessary. (see the above lab we will be doing soon on sound for guidance on what your lab sheet should look like)
- A few of the URLs are videos about demonstrations or concepts about light, if you pick one of these you will need to watch the video carefully, decide what the learning objective is, and come up with at least 10 questions that students will answer after watching the video.
https://www.exploratorium.edu/snacks/rotating-light
http://www.exploratorium.edu/science_explorer/reflecting_rainbows.html
https://www.exploratorium.edu/video/double-rainbows
https://www.exploratorium.edu/exhibit/aurora
https://www.exploratorium.edu/snacks/disappearing-glass-rods
https://www.exploratorium.edu/snacks/diffraction
https://www.exploratorium.edu/explore/videos/snacks/cd-spectroscope-introduction
https://www.exploratorium.edu/snacks/poking-fun-at-light-rays
https://www.exploratorium.edu/video/making-color
https://makingscience.withgoogle.com/science-journal/activities/activity-getting-started-light?lang=en
https://makingscience.withgoogle.com/science-journal/activities/activity-light-instruments-discovering-shadows?lang=en#setup
https://www.exploratorium.edu/video/light-island
https://docs.google.com/document/d/11vKrlnwcilA0bT3zdz2ZvRweuD_r185wZOQOoOj2JRQ/edit
So pick one, reserve it for your team, and get to work on being a teacher of light!
|
|
|
Team Evaluations - "Light Lessons"
Activity #8. Waves Reading
LEARNING OBJECTIVE: I will learn about waves and how they work. I can read our Science Textbook and answer the questions at the start and end of each section. I can also collect keywords and definitions.
INSTRUCTIONS:
1. Read pages 61-73 in our Science Textbook
2. Take notes in your science journal. Answer the questions at the start and end of each section in your journal. Collect keywords and their definitions in your science journal as well. You will use these words and the words you previously collected for your Quizlet.
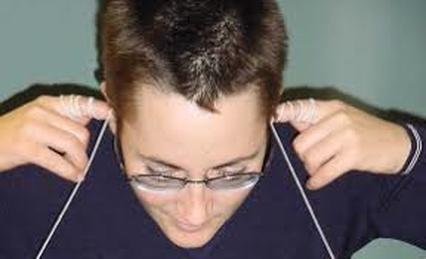
Lab #5: Sound and Sound Waves Team Lab Activities
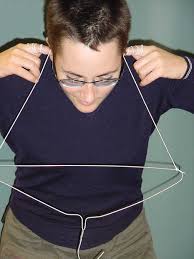
Hangers and Sound Waves
LEARNING OBJECTIVE: I will learn that sound travels differently through different types of medium; I can use hangers and different types of medium to test how sound waves travel; I can document my findings in a chart.
MATERIALS:
- Sound Wave Hangers
- iPad
- CANVAS account
- Do not put hangers in your ears, only put the string/metal type materials next to your ear NOT IN YOUR EARS!
- Do not use the hangers to hit anyone or anything other than the table in order to start the sound waves.
|
|
INSTRUCTIONS:
1. Decide who will be the Reader, the Materials Manager, and the Team Manager. READ THROUGH ALL OF THE INSTRUCTIONS BEFORE STARTING ACTIVITY!!!!
2. Open the Hanger Sound Waves LabSheet in Notability. Fill out the Data Table as instructed on the LabSheet.
3. Send over the Materials Manager for the hangers, once everyone has read the lab instructions.
4. There are 6 hangers for each group to use. Take turns using each of the hangers. Use the hanger, then record the data. Work your way through all 6 hangers.
5. To use the hanger sound device - Put the medium in front of the opening of your ears, press it with your fingers so you are closing off the opening to your ear - Do not put the medium inside of your ears! While holding the medium to both ears, move your head and torso in order to allow the hanger to hit against the table. Listen carefully to the sound that is being sent through the medium to your ears.
6. Fill out the information for each hanger tested in your table. Be sure to describe the sounds you are hearing in great detail.
7. Before moving on to the next hanger, mass out the material from one side of the hanger (the "string" that goes to one ear) and record the information in your chart. Leave the "Reasoning for Sound Outcome" column until you have completed all six tests.
8. Once all 6 hangers have been tested and massed, and your data recorded in your chart, look at the outcomes for each of the items and compare your outcomes. Why do you think you received the sound outcome you did for each item? Does it have to do with the material itself, the mass of the material, what? Write your thoughts for each sound outcome in your chart.
9. On the LabSheet, answer the following questions:
A. Did you receive the results you thought you would for each material tested? Explain the differences or similarities between your initial thoughts and your actual outcomes.
B. What material had the loudest sound? Explain why.
C. What material had the quietest sound? Explain why.
D. Did the mass of the object dictate the volume of the sound? Explain findings.
E. What would the wave lengths of loudest sound look like - draw an example.
F. What would the wave lengths of the quietest sound look like - draw an example.
10. Once you have completed the lab and the lab sheet, upload your lab sheet to CANVAS.
| hanger_and_sound_waves_lab.pdf |
Lab #6: Sound Waves through Gas
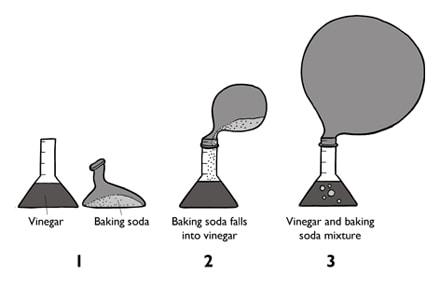
The learning objective of this activity is to understand how sound waves travel through different gases.
Materials:
1. In your science journal write down the heading "Balloons, Gases, and Sound Waves," then follow the following instructions.
2. DECIDE who will do each of the following tasks during this activity:
READER LEADER- reads the instructions to the group, and keeps team on task
CO2 CREATOR - put on safety goggles; Without dumping the baking soda, which is in your balloon, fasten the balloon onto the opening of the test tube. Once the balloon is covering the opening of the test tube, slowly pour in the contents of the ballon into the test tube. Once the balloon has filled with CO2, pinch the balloon near where it is connected to the test tube, then tie off the end of the balloon with a knot.
BALLOON BLOWER - blows up the other balloon using your own air, then ties off the balloon
3. When your team's READER has read the instructions to your team, assign each person on the team to use a different colored marker. THEN, put the vinegar found in the small beaker into the beaker with the baking soda. IMMEDIATELY attach the balloon to the beaker so that the balloon will fill with CO2.
4. There are three roles for this next step:
MEASURER - use the meter stick to measure 1 meter distance and have the other two team members stand on each end of the measured distance.
LISTENER - put the balloon to one of your ears and listen intently
NOISY PERSON - Either talk or clap in the direction of the LISTENER's ear
Have the LISTENER stand in place and hold the balloon up to his or her ear. Have a NOISY PERSON stand on the other side of the balloon, about 3 feet (1 meter) away from the center of the balloon, and make noise: encourage him or her to talk, sing, or clap their hands to produce sounds. The LISTENER should then move the balloon around to find the position in which the sound is loudest.
The point where the sound is the loudest should be on a straight line from the sound source through the center of the balloon to about 18 in (46 cm) away from the center. The exact distance will depend on the size of your balloon and the position of the sound source.
When you find the loudest location, using your marker, mark the spot on the balloon with with a #1. Now remove the balloon and listen to the noise again.
NOW, have the MEASURER measure out 3 meters distance and try the same experiment again. Again, mark the position on the balloon with a #2, where the sound is heard the loudest.
5. Repeat the same activity using the air filled balloon.
6. The LISTENER, now becomes the MEASURER. The MEASURER becomes the NOISY PERSON, and the NOISY PERSON becomes the LISTENER. Repeat all tasks again until everyone has had a turn at all three tasks.
7. In your journal, write down your observations:
9. Drawing on what we have learned earlier this year about chemical reactions, name the reactant(s) and the product to the chemical reaction that you preformed today. Write this information down in your science journal.
10. CLEAN UP Lab:
A. Clean out the beakers using one drop of soap and water. Swirl the water around and use the test tube scrubber as needed to get all of the baking soda out of the beaker. Rinse the beakers and be sure that they are clean. Leave the beakers on the drying rack.
B. Throw the balloons away.
C. Put the meter stick, and 3 colored markers back on your tray.
D. Check the floor around your table for garbage and throw it away properly.
E. Have Mrs. Smith check your team for cleanliness. Push in your chairs before leaving the room.
11. Have an awesome rest of your day, knowing you are more knowledgeable about sound and waves then when you walked in the door today. :)
Materials:
- test tube with vinegar
- safety goggles
- baking soda
- beaker
- 2 balloons
- your air
- meter stick
- 3 different colored markers
- Wear safety goggles while handing balloons!
- Do not overly fill balloons, we don't want them popping in people's faces. :)
- Do not breathe in the CO2 coming from the beaker - it needs to be used to fill your balloon.
1. In your science journal write down the heading "Balloons, Gases, and Sound Waves," then follow the following instructions.
2. DECIDE who will do each of the following tasks during this activity:
READER LEADER- reads the instructions to the group, and keeps team on task
CO2 CREATOR - put on safety goggles; Without dumping the baking soda, which is in your balloon, fasten the balloon onto the opening of the test tube. Once the balloon is covering the opening of the test tube, slowly pour in the contents of the ballon into the test tube. Once the balloon has filled with CO2, pinch the balloon near where it is connected to the test tube, then tie off the end of the balloon with a knot.
BALLOON BLOWER - blows up the other balloon using your own air, then ties off the balloon
3. When your team's READER has read the instructions to your team, assign each person on the team to use a different colored marker. THEN, put the vinegar found in the small beaker into the beaker with the baking soda. IMMEDIATELY attach the balloon to the beaker so that the balloon will fill with CO2.
4. There are three roles for this next step:
MEASURER - use the meter stick to measure 1 meter distance and have the other two team members stand on each end of the measured distance.
LISTENER - put the balloon to one of your ears and listen intently
NOISY PERSON - Either talk or clap in the direction of the LISTENER's ear
Have the LISTENER stand in place and hold the balloon up to his or her ear. Have a NOISY PERSON stand on the other side of the balloon, about 3 feet (1 meter) away from the center of the balloon, and make noise: encourage him or her to talk, sing, or clap their hands to produce sounds. The LISTENER should then move the balloon around to find the position in which the sound is loudest.
The point where the sound is the loudest should be on a straight line from the sound source through the center of the balloon to about 18 in (46 cm) away from the center. The exact distance will depend on the size of your balloon and the position of the sound source.
When you find the loudest location, using your marker, mark the spot on the balloon with with a #1. Now remove the balloon and listen to the noise again.
NOW, have the MEASURER measure out 3 meters distance and try the same experiment again. Again, mark the position on the balloon with a #2, where the sound is heard the loudest.
5. Repeat the same activity using the air filled balloon.
6. The LISTENER, now becomes the MEASURER. The MEASURER becomes the NOISY PERSON, and the NOISY PERSON becomes the LISTENER. Repeat all tasks again until everyone has had a turn at all three tasks.
7. In your journal, write down your observations:
- What did the sound, sound like with the CO2 balloon over your ear in comparison to listening to the sound without the balloon?
- What do you think is happening to the sound waves?
- How is the CO2 is affecting sound waves? Why?
- What happened when the NOISY PERSON moved farther away?
- Looking at the marks on your balloon, what can you conclude about how sound travels?
- How is this experiment similar to the water waves lab we did a couple weeks ago? Do you think the sound waves travel in the same way that the water waves travel? What evidence do you have to support your answer?
9. Drawing on what we have learned earlier this year about chemical reactions, name the reactant(s) and the product to the chemical reaction that you preformed today. Write this information down in your science journal.
10. CLEAN UP Lab:
A. Clean out the beakers using one drop of soap and water. Swirl the water around and use the test tube scrubber as needed to get all of the baking soda out of the beaker. Rinse the beakers and be sure that they are clean. Leave the beakers on the drying rack.
B. Throw the balloons away.
C. Put the meter stick, and 3 colored markers back on your tray.
D. Check the floor around your table for garbage and throw it away properly.
E. Have Mrs. Smith check your team for cleanliness. Push in your chairs before leaving the room.
11. Have an awesome rest of your day, knowing you are more knowledgeable about sound and waves then when you walked in the door today. :)
Microwaves and Chocolate Demonstration Lab
Measure the speed of light using chocolate. Nuke your chocolate and measure a fundamental physics constant. Remember E=mc2, Einstein's famous equation? The 'c' stands for the speed of light. You don't need fancy equipment to measure it. All you need is a microwave, ruler, bar of chocolate and a calculator.
LEARNING OBJECTIVE: I will be able to see the length of a microwave wave length, and compare it to the speed of light. I can heat chocolate in a microwave oven, measure the wavelengths, and calculate the the speed of the microwave wave lengths to compare with the speed of light.
SAFETY:
INSTRUCTIONS:
What answer do you get for z? Remember, if you measured the distance between the melted spots in centimeters, z will be in centimeters per second. To get an answer in meters per second, divide z by 100.
The speed of light is 299,792,458 meters per second. OR round to 300,000,000 meters/second
In your science journal:
What's happening?
Microwaves are a type of electromagnetic radiation, just like light waves. Microwaves also travel at the speed of light. If you measure how fast they are travelling, you should get a result close to the speed of light.
Wavelength
When you measure the distance between two melted spots you can work out the wavelength of the microwaves.
Measuring the distance between melted spots gave you half a wavelength. You need to multiply the distance by two to get a whole wavelength.
The distance between two melted spots is half a wavelength
Frequency
Now you know the wavelength you need to know the wave frequency. Wave frequency is how many times a wave bounces up and down in one second. This is 2.45 gigahertz in most microwaves. This means that a wave will move up and down 2.45 billion times per second.
Speed
Speed of light = wavelength x frequency
The distance between each melted spot should be around 6 centimetres.
6 x 2 x 2450000000 = 29400000000 cm/s
This is equivalent to 294,000,000 metres per second. That's pretty close to the speed of light!
Now you've satisfied your curiosity, you can eat the chocolate. A well deserved reward for you hard work.
LEARNING OBJECTIVE: I will be able to see the length of a microwave wave length, and compare it to the speed of light. I can heat chocolate in a microwave oven, measure the wavelengths, and calculate the the speed of the microwave wave lengths to compare with the speed of light.
SAFETY:
- Wash hands and keep them clean during the activity so that you will be able to eat the chocolate at the end of the activity. (You will be dividing the bar with the members on your team)
INSTRUCTIONS:
- Using clean hands, take your chocolate bar out of the wrapper and put it on the paper plate.
- Put a plate upside down over the thing that rotates the turntable (does that have a name? For now I'm going with 'rotator').
- Put your chocolate in the middle of the plate.
- Heat the chocolate until it starts to melt in two or three places. This should take about 20 seconds.
- Take the chocolate out of the microwave - carefully! It will be hot. Measure the distance between the melted spots.
- If your microwave is a standard model, it will have a frequency of 2.45 gigahertz. This means that the microwaves move up and down 2.45 billion times per second.
- Multiply the distance between the spots on the chocolate bar by two. Multiply that by 2,450,000,000 (2.45 gigahertz expressed as hertz).
What answer do you get for z? Remember, if you measured the distance between the melted spots in centimeters, z will be in centimeters per second. To get an answer in meters per second, divide z by 100.
The speed of light is 299,792,458 meters per second. OR round to 300,000,000 meters/second
In your science journal:
- Explain the procedures that you followed for the activity
- Write down your calculations for the soft spots in your chocolate. Be sure that you write out the equation and answers. You can use a calculator but you still must write down the equations and the answers.
- Explain whether or not your calculations were close to the speed of light? If so, why??? If not, why???
- Using Google, research what the wavelength is for a microwave - how does this compare to your findings and calculations???
What's happening?
Microwaves are a type of electromagnetic radiation, just like light waves. Microwaves also travel at the speed of light. If you measure how fast they are travelling, you should get a result close to the speed of light.
Wavelength
When you measure the distance between two melted spots you can work out the wavelength of the microwaves.
Measuring the distance between melted spots gave you half a wavelength. You need to multiply the distance by two to get a whole wavelength.
The distance between two melted spots is half a wavelength
Frequency
Now you know the wavelength you need to know the wave frequency. Wave frequency is how many times a wave bounces up and down in one second. This is 2.45 gigahertz in most microwaves. This means that a wave will move up and down 2.45 billion times per second.
Speed
Speed of light = wavelength x frequency
The distance between each melted spot should be around 6 centimetres.
6 x 2 x 2450000000 = 29400000000 cm/s
This is equivalent to 294,000,000 metres per second. That's pretty close to the speed of light!
Now you've satisfied your curiosity, you can eat the chocolate. A well deserved reward for you hard work.
Water, laser, and a straw - It's about Refraction
Demonstration of Refraction. Draw pictures in our science journal and take notes. Explain what refraction is in your science journal.
Lab #7: The Rainbow Phenomenon and Newton's Optics Experiment Lab

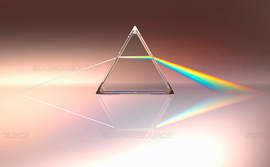
LEARNING OBJECTIVE: I will learn about refraction, the light spectrum, and how white light is produced. I can complete a prism experiment to help me learn about how light.
MATERIALS:
SAFETY:
DO NOT SHINE THE FLASHLiGHT IN ANYONE'S EYES, INCLUDING YOUR OWN!
INSTRUCTIONS:
1. Read the following about Isaac Newton's Optic Experiment:
In 1665, Isaac Newton was a young scientist studying at Cambridge University in England. He was very interested in learning all about light and colors. One bright sunny day, Newton darkened his room and made a hole in his window shutter, allowing just one beam of sunlight to enter the room. He then took a glass prism and placed it in the sunbeam. The result was a spectacular multicolored band of light just like a rainbow. The multicolored band of light is called a color spectrum.
Newton believed that all the colors he saw were in the sunlight shining into his room. He thought he then should be able to combine the colors of the spectrum and make the light white again. To test this, he placed another prism upside-down in front of the first prism. He was right. The band of colors combined again into white sunlight. Newton was the first to prove that white light is made up of all the colors that we can see. (Source: © 1995-2013 by Michael W. Davidson, Kirill I. Tchourioukanov, and Florida State University)
2. Set up your black tent to help direct the light and keep the ambient light out of your experiment.
3. Inside of the area of your black tent, put the prism down and position the white card against the black tent. By shining the flashlight through the prism can you create a rainbow on the white card?
4. Once you've accomplished this task, draw out the position of the light going into the prism and coming out the other side of the prism in your science notebook. This is refraction and you are showing the angle of refraction as light is traveling through the prism. Why are the colors in the same order going through the prism as you would see in a rainbow? Write the explanation in your science journal.
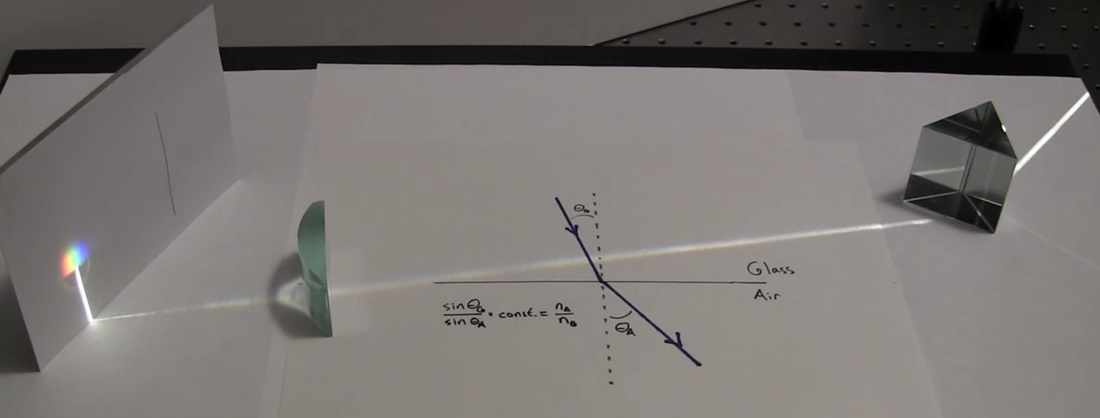
Refraction is the bending of the path of a light wave as it passes across the boundary separating two media. Refraction is caused by the change in speed experienced by a wave when it changes medium. (Definition Source: The Physicsclassroom.com)
5. Now using the lens add it to your set up as shown in the photo below. In your science journal, draw a picture of the set up and write down your observations. Explain what is happening to the light as it passes through the prism and then passes through the lens.
6. Explain in your science journal the different mediums that the light is going through. Do some research to find out the speed of light when it travels through these different mediums. Is the light slower or faster when it goes through the air or the prism or the lens?
7. Explain why the light going through the prism made the rainbow and why when the light continued through the lens that it created white light again.
MATERIALS:
- Flashlight
- Prism
- White Card
- Black Tent
- Lens
SAFETY:
DO NOT SHINE THE FLASHLiGHT IN ANYONE'S EYES, INCLUDING YOUR OWN!
INSTRUCTIONS:
1. Read the following about Isaac Newton's Optic Experiment:
In 1665, Isaac Newton was a young scientist studying at Cambridge University in England. He was very interested in learning all about light and colors. One bright sunny day, Newton darkened his room and made a hole in his window shutter, allowing just one beam of sunlight to enter the room. He then took a glass prism and placed it in the sunbeam. The result was a spectacular multicolored band of light just like a rainbow. The multicolored band of light is called a color spectrum.
Newton believed that all the colors he saw were in the sunlight shining into his room. He thought he then should be able to combine the colors of the spectrum and make the light white again. To test this, he placed another prism upside-down in front of the first prism. He was right. The band of colors combined again into white sunlight. Newton was the first to prove that white light is made up of all the colors that we can see. (Source: © 1995-2013 by Michael W. Davidson, Kirill I. Tchourioukanov, and Florida State University)
2. Set up your black tent to help direct the light and keep the ambient light out of your experiment.
3. Inside of the area of your black tent, put the prism down and position the white card against the black tent. By shining the flashlight through the prism can you create a rainbow on the white card?
4. Once you've accomplished this task, draw out the position of the light going into the prism and coming out the other side of the prism in your science notebook. This is refraction and you are showing the angle of refraction as light is traveling through the prism. Why are the colors in the same order going through the prism as you would see in a rainbow? Write the explanation in your science journal.
Refraction is the bending of the path of a light wave as it passes across the boundary separating two media. Refraction is caused by the change in speed experienced by a wave when it changes medium. (Definition Source: The Physicsclassroom.com)
5. Now using the lens add it to your set up as shown in the photo below. In your science journal, draw a picture of the set up and write down your observations. Explain what is happening to the light as it passes through the prism and then passes through the lens.
6. Explain in your science journal the different mediums that the light is going through. Do some research to find out the speed of light when it travels through these different mediums. Is the light slower or faster when it goes through the air or the prism or the lens?
7. Explain why the light going through the prism made the rainbow and why when the light continued through the lens that it created white light again.
Similarities and Differences Table/Notes
Using all of your notes and findings from the activities and labs you have done and watched, answer the following questions with your teammates. You will write all of the answers to these questions in your science journal either as a Q and A or in a Table format - whichever works best for you. Decide which teammate will answer each question and then share your answers with each other. Decide together whether or not "Are all waves the same?" or are there certain similarities and differences?
This exercise will help you all formulate your FINAL answer to our Phenomenon Question - "Are All Waves the Same?" Remember that when we say "All Waves" we are specifically talking about mechanical waves, light waves, sound waves, microwaves, P- and S-Waves, and ocean waves. AND remember you will need to explain your FINAL answer so that means you will need to explain this information.
1. What are the characteristics of sound waves?
2. What are the characteristics of light waves?
3. What are the characteristics of microwaves?
4. What are the characteristics of P-Waves and S-Waves?
5. What are the characteristics of mechanical waves? (make sure you know what kind of waves fall under mechanical waves)
6. Do all waves need medium to travel through?
7. Do all waves reflect?
8. Do all waves refract?
9. Can all waves experience compression?
10. Can all waves experience rarefaction?
11. Can all waves be measured by wavelengths?
12. Does energy travel through all types of waves?
13. Can all waves be absorbed into different materials?
Quizlet
Use the phenomenon question for the title of your quizlet set.
Here are your quizlet words:
Refraction
Rarefraction
Reflection
Compression
P-Wave
S-Wave
Surface Wave
Longitudinal Wave
Transverse Wave
Crest
Trough
Amplitude
Wavelength
Hertz
Wave Frequency
Period
Medium
Mechanical Waves (List all types of)
Electromagnetic Wave
FINAL OVERVIEW
1. Download the "Overview of WAVES" document below. Complete it. You may use a textbook, and/or your notes if needed.
Once you completed it, then upload it to CANVAS.
2. Watch this NASA video about the sound on Mars
3. Please read about NASA's Sound Suppression System and take notes in your science journal.
Once you completed it, then upload it to CANVAS.
2. Watch this NASA video about the sound on Mars
3. Please read about NASA's Sound Suppression System and take notes in your science journal.
| overview_of_waves.pdf |
